
Debugging complex programs often feels like navigating a labyrinth of threads and stack traces. The challenge of understanding thread behaviors and tracing issues can be daunting, leading to longer development times and increased frustration. But now, there’s a solution that simplifies this process—introducing AI-powered thread summaries in Parallel Stacks Window with Visual Studio.
To address these challenges, Visual Studio introduces two AI-powered features that make debugging more intuitive: thread summaries and app summarization. These enhancements bring clarity to your debugging workflow by providing concise explanations of thread activity and interactive AI-driven assistance.
AI-generated thread summaries
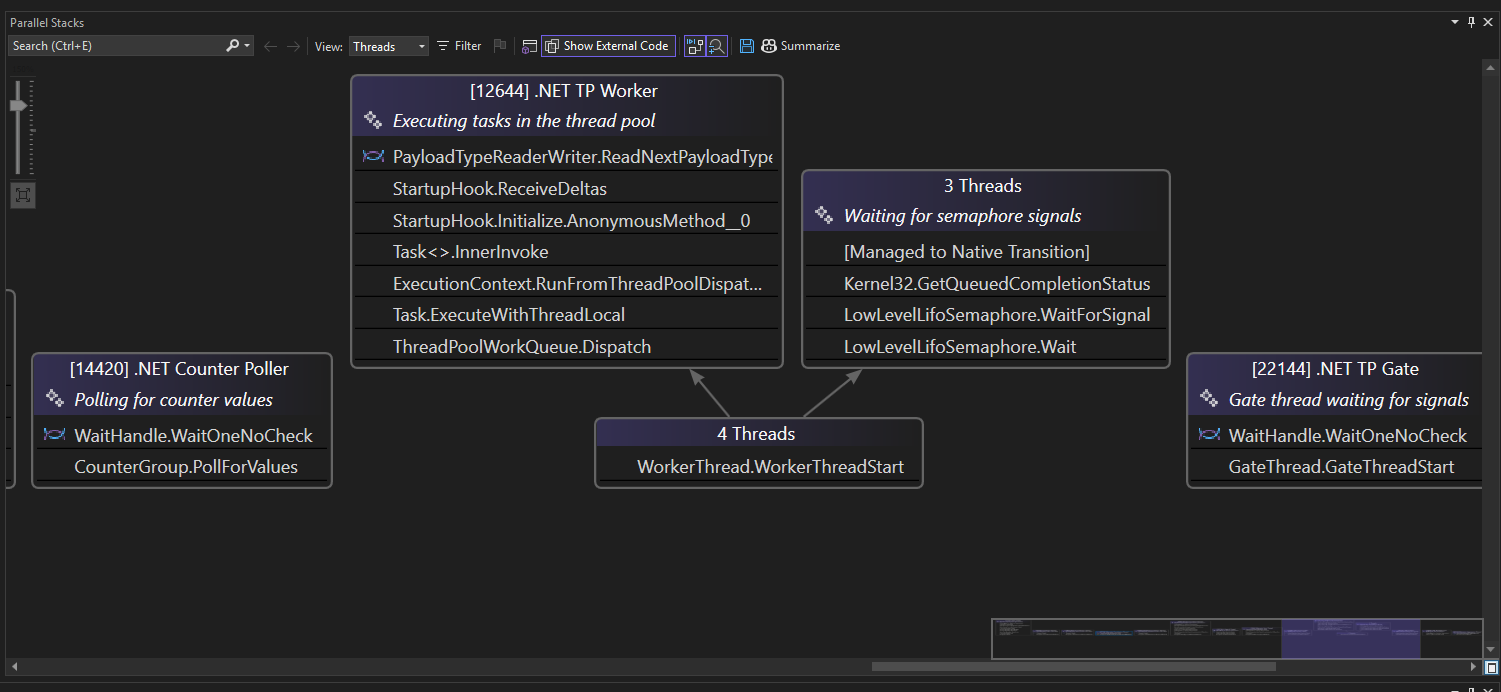
Understanding what each thread is doing at any given moment is crucial when working with parallel execution. The auto summaries feature in Parallel Stacks Window helps developers quickly gain context by generating AI-powered summaries for each thread. Instead of manually analyzing individual stack frames, you can now get a high-level overview at a glance.
When you open the Parallel Stacks Window, these summaries appear at the top of each thread. These summaries provide a high-level overview of each thread’s current activity, helping you quickly grasp their purpose and status.
App Summarization with Copilot
Taking AI assistance a step further, the app summarization feature in Parallel Stacks Window enables developers to interactively explore and resolve debugging challenges with Copilot Chat. This feature doesn’t just summarize— it allows you to ask questions, get explanations, and receive AI-powered suggestions tailored to the debugging context.
Instead of just presenting raw call stacks, this integration provides clear overviews of each thread’s actions, potential issues, and fixes. This results in a more intuitive approach to multi-threaded debugging, significantly reducing the time needed to understand and resolve complex thread interactions.
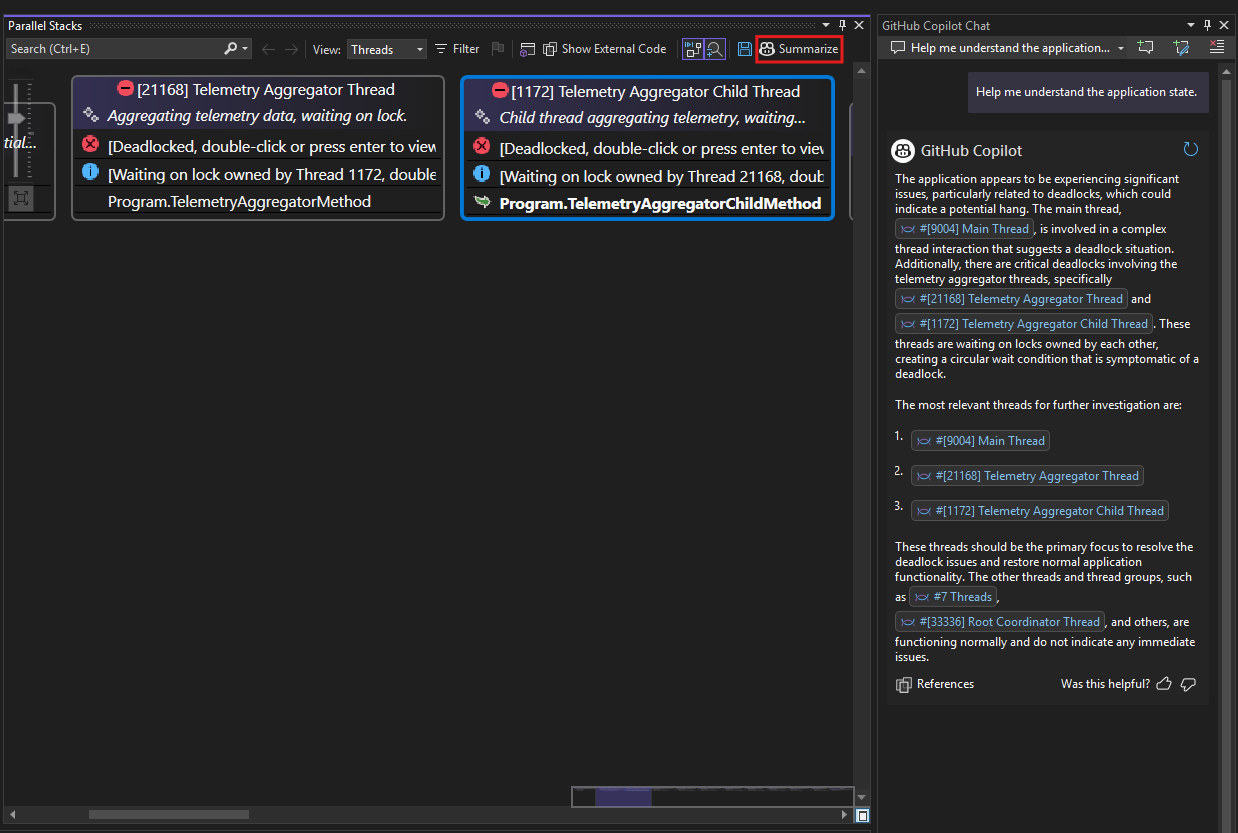
To use this feature, simply click the “summarize” button at the top of the Parallel Stacks Window. This will open the Copilot Chat on the side, preloaded with relevant thread context. You can then engage in an interactive, AI-powered conversation to resolve common threading issues such as deadlocks and race conditions while optimizing your threading model for better efficiency and reliability.Bottom of Form
By seamlessly combining parallel stack insights with Copilot Chat’s app summaries, Visual Studio streamlines your debugging workflow, empowering you to diagnose, understand, and address threading issues with greater confidence and speed.
Try It Out
Both AI-generated thread summaries and app summarization aim to reduce debugging time and improve developer productivity. Whether you need a high-level overview or an in-depth analysis of a thread, these features provide the clarity and intelligence required to navigate complex debugging scenarios.
Please try it out and give us some feedback. Your insights and suggestions are invaluable as we strive to make Visual Studio the best development environment for you.
Thank you for helping us make Visual Studio better every day.
The post Make more sense of multithreaded debugging appeared first on Visual Studio Blog.