
Over the past 5 years, we’ve had many incredible opportunities to engage with game developers. From AAA studios to indie developers, the passion for slashing iteration times is significant. Amidst all the fantastic feedback we’ve received for Visual Studio, one sentiment has rung loud and clear: a desire to debug optimized C++ code without sacrificing performance. Although game developers have voiced this need the loudest, we know that solving this issue will benefit many other C++ workflows. While we’ve consistently rolled out many productivity and performance enhancements over the years, debugging optimized code has always been at the top of everyone’s wish list.
Current Issues with Debugging Optimized Code
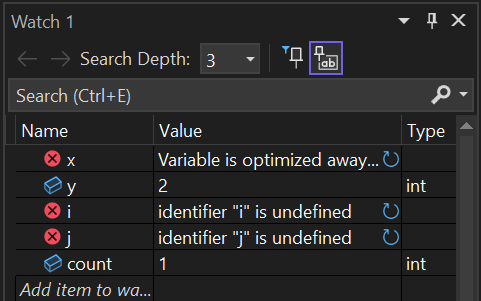
Through our conversations with game developers, we’ve heard about some common problems when debugging optimized code:
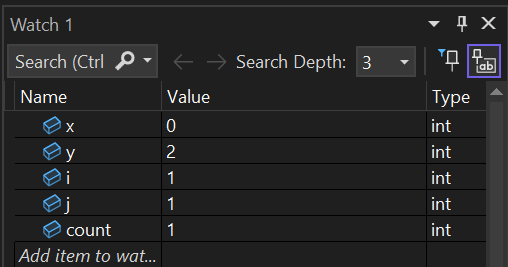
- Trying to inspect locals often yields the “Variable is optimized away” message in the watch window.
- Step-over and step-into don’t always step over, or into, the expected code paths.
- Losing time while iterating with #pragma optimize to try and undo optimizations, requiring a rebuild and restart of the debugger.
Thanks to your feedback, the team has been hard at work to come up with a creative solution.
Announcing: C++ Dynamic Debugging
We are thrilled to announce that C++ Dynamic Debugging is now available as a preview feature exclusively with the MSVC toolset. This feature dynamically deoptimizes code that you set breakpoints on or step into, giving you the performance of optimized code with the debugging experience of unoptimized code.
Try C++ Dynamic Debugging today in Visual Studio 2022 version 17.14 Preview 2.

“The new feature is exceptional. I now have reliable stepwise debugging, variable inspection, and program counter jumping without needing to recompile with pragma optimize.”
– Jess Kube, Principal Software Engineer, The Coalition
Using it daily, the new feature improved my ability to debug and investigate quicker. I don’t need to manually deoptimize my files anymore”
– Matthew Koch, Principal Software Engineer, Halo Studios
“With the new feature, breakpoints in inlined functions will now be hit. Previously, I had to use a debug build or #pragma optimize and remember to remove it before code review”
– Keith Stockdale, Senior Software Engineer, Rare
Getting Started with C++ Dynamic Debugging
You only need a few short clicks to turn on C++ Dynamic Debugging for your project. After activating these options, you must rebuild to start using C++ Dynamic Debugging.
MSBuild C++ Projects
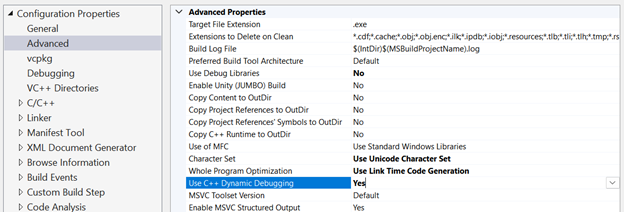
To begin, change your configuration to Release mode. Next, right-click on your project and click on Properties to open the Configuration Properties menu. In this menu, click on Advanced > Use C++ Dynamic Debugging > Yes. Lastly, rebuild your project.
Setting this property will turn off Whole Program Optimization.
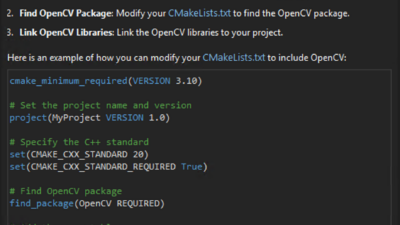
Other Build Systems
- Pass the new /dynamicdeopt switch to cl.exe, lib.exe, and link.exe
- For Unreal Engine developers, UE 5.6 will support the bDynamicDebugging Windows platform flag.
Please see documentation for more details.
System Requirements
- Visual Studio 2022 Version 17.14 Preview 2
- MSVC Toolset 19.44
- X64 architecture
- Not compatible with LTCG, PGO, OPT-ICF flags
Using C++ Dynamic Debugging
Turning on C++ Dynamic Debugging and rebuilding unlocks familiar debugging patterns for optimized code without compromising on performance.
Breakpoints
Your breakpoints will get hit in deoptimized code. Look for the [Deoptimized] tag in the Call Stack window to know that you can view all your locals.
Conditional and Dependent Breakpoints
Set Conditional and Dependent Breakpoints as if the code was unoptimized; you can add conditional breakpoints to variables that have been optimized away in your optimized binaries.
Stepping Actions
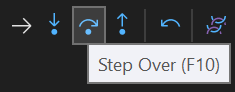
Step Over to the next line of your source code as if the code was unoptimized.
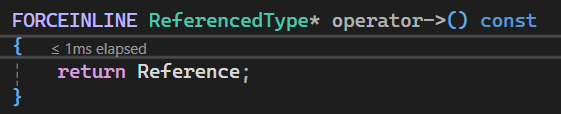
Step In to any function, and those functions will be deoptimized as well. In addition, Step In will now step into __forceinline functions.
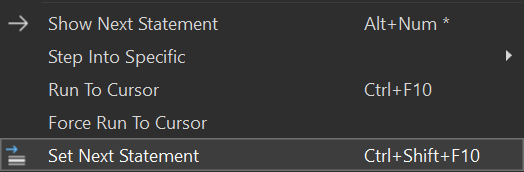
Set Next Statement
Using Set Next Statement in a deoptimized frame works as if the code was unoptimized.
Call Stack Window
In your Call Stack window, you will see that any frames that have been deoptimized will have a [deoptimized] tag.
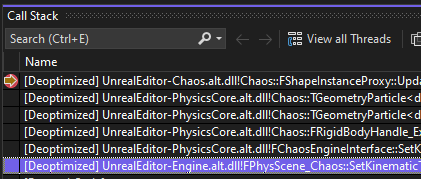
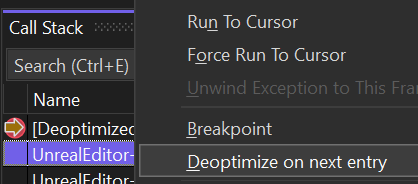
Visual Studio only deoptimizes the frame corresponding to your breakpoint or functions stepped into. Frames higher up in the call stack remain optimized for performance. You can select additional frames in the Call Stack window and click “Deoptimize on next entry” to deoptimize those functions when they are entered the next time.
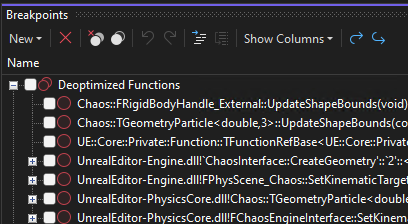
Managing “Deoptimize on next entry” breakpoints
Breakpoints added through “Deoptimize on next entry” are listed in the Breakpoints window. You can export these Breakpoints for later use. To return your application to full optimization, delete these breakpoints.
Middleware Support
We have been working closely with our middleware partners to ensure that C++ Dynamic Debugging works with popular middleware tools.
Unreal Engine
In Unreal Engine version 5.6, Unreal Build Tool and Unreal Build Accelerator will support C++ Dynamic Debugging natively. To try the feature today, please manually apply the change, temporarily disable Unreal Build Accelerator, and see our documentation for more details.
IncrediBuild
IncrediBuild 10.24 or later supports C++ Dynamic Debugging.
FastBuild
To use C++ Dynamic Debugging with FastBuild, please see this Pull Request.
Xbox GDK
Out-of-the-box support for C++ Dynamic Debugging will be available in an April 2025 update. To try this feature today, please refer to the official GDK documentation.
Overhead Considerations
While using C++ Dynamic Debugging, it’s important to acknowledge the following considerations. Despite these overhead costs, we are confident that your overall iteration time will benefit significantly.
File Output Size
In our assessments, using a modified version of the Lyra Sample project, we observed a 2.4x increase in the build output size.
Build Time
End-to-end Build Time
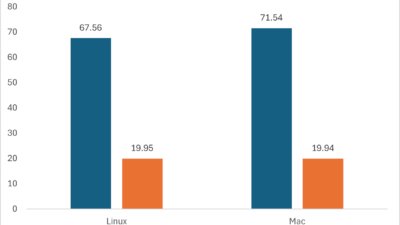
Depending on the project, we saw an increase in end-to-end build time ranging from 1.05x to 1.15x.
Iteration Build Time
For small and medium-sized binaries, the increase in iteration build time was less than 1.2x. For larger binaries, such as monolithic games, the increase was up to 1.8x.
Mitigations for Iteration Build Time
If the increase in iteration time is too burdensome for large binaries, you can try the undocumented /d2DDTrimInlines compiler switch. This switch, subject-to-change and removal, reduces the iteration time overhead from 1.8x to 1.4x at the cost of increased end-to-end build time. The switch also removes the ability to step into small __forceinline/inline functions.
Known Issues
By design:
- Unexpected PDB error, LIMIT (12), check for insufficient disk space, invalid path, or insufficient privilege.
- Stepping in disassembly window remains optimized.
Fixed in Visual Studio 2022 17.4 Preview 3:
- Crash with memcmp and other intrinsic imports with /MD
- Incorrect emission of C4714
- Missing feature from x86_x64 compiler
- Instrumentation-based profiling doesn’t work
- Crash stepping past C++ exception catch handlers
Active Issues:
- Starting the debugger with F10 or F11 keeps main() optimized
- ImageBase is 0 when debugging
- Crash stepping into __try block that has access violation
Conclusion
Try C++ Dynamic Debugging today: Experience the benefits of debug builds and the speed of optimized builds.
C++ Dynamic Debugging is a preview feature. Thank you to everyone who gave us feedback on debugging optimized code. This feature would not have been possible without your feedback. We love to hear how much time this feature has saved you and how you’re incorporating it into your workflow. Furthermore, we invite you to keep sending feedback so we can make C++ Dynamic Debugging even better. We truly appreciate your feedback and encourage you to keep sharing your thoughts and ideas with us through Developer Community, X (@VisualC), or email at visualcpp@microsoft.com.
The post C++ Dynamic Debugging: Full Debuggability for Optimized Builds appeared first on C++ Team Blog.